Published: 12 December 2008
Innovations play a variety of roles in the development of entrepreneurial activity
Revised edition: Data on innovations' proportions of turnover have been corrected on 12 December 2008. The corrections are indicated in red.
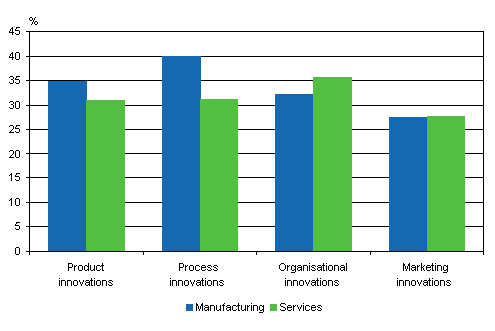
During the period 2004–2006 enterprises engaged in activity connected with product or process innovations more often than previously. When compared with the previous survey on the years 2002–2004, the number of enterprises with process innovations grew both in manufacturing and in the examined service industries. Additionally, a greater share than previously of the enterprises in the service industries reported product innovations. According to enterprises’ reports, the product innovations introduced to the market in 2004–2006 represented a total of 16 per cent of their total turnover in 2006.
In addition to new or improved products and processes, enterprises also innovated in the fields of marketing and organisation. Unlike for product and process innovations, the adoption of organisational innovations in 2004–2006 was more common in services than in manufacturing. Similarly to product and process innovations, the adoption of marketing and organisational innovations became more common with increasing size of enterprise and was more common in group enterprises than in independent enterprises. A large part of the enterprises with innovations reported having made various different types of innovations during the period under examination. Often the different types of innovations in an enterprise were connected to one another.
The data derive from Statistics Finland survey on innovation activity among enterprises in 2004–2006. Key results from this survey were published already in February 2008.
Enterprises introducing innovations in 2004-2006, share of enterprises

Source: Innovation 2006, Statistics Finland
Inquiries: Mervi Niemi (09) 1734 3263, tiede.teknologia@stat.fi
Director in charge: Leena Storgårds
Publication in pdf-format (576.7 kB)
- Tables
-
Tables in databases
Pick the data you need into tables, view the data as graphs, or download the data for your use.
Appendix tables
- Table 1. Prevalence of innovation activity by size category of personnel, 2004-2006, share of enterprises (12.12.2008)
- Table 2. Prevalence of innovation activity by industry, 2004-2006, share of enterprises (12.12.2008)
- Table 3. Prevalence of innovation activity by form of enterprise, 2004-2006, share of enterprises (12.12.2008)
- Table 4. Prevalence of innovation activity by level of technology, 2004-2006, share of enterprises (12.12.2008)
- Table 5. Proportion of enterprises with innovation activity of turnover and employment by size category of personnel, 2006 (12.12.2008)
- Table 6. Prevalence of product (good or service) innovations by size category of personnel, 2004-2006, share of enterprises (12.12.2008)
- Table 7. Prevalence of product (good or service) innovations by industry, 2004-2006, share of enterprises (12.12.2008)
- Table 8. Developers of product and process innovations by size category of personnel, 2004-2006, share of enterprises and of enterprises with innovations (12.12.2008)
- Table 9. Developers of product and process innovations by industry, 2004-2006, share of enterprises with innovations (12.12.2008)
- Table 10. Share of enterprises having produced new products for the market by size category of personnel, 2004-2006 (12.12.2008)
- Table 11. Share of enterprises having produced new products for the market by industry, 2004-2006 (12.12.2008)
- Table 12.Proportion of product innovations and unchanged products of turnover by size category of personnel, 2006 (12.12.2008)
- Table 13. Proportions of product innovations and unchanged products of turnover by industry, 2006 (12.12.2008)
- Table 14. Prevalence of process innovations by size category of personnel, 2004-2006, share of enterprises (12.12.2008)
- Table 15. Prevalence of process innovations by industry, 2004-2006, share of enterprises (12.12.2008)
- Table 16. Co-operation in innovation activity by significance of co-operating partner, 2004-2006, share of enterprises with innovation activity (12.12.2008)
- Table 17. Share of enterprises indicating high or medium importance of co-operating partner by size category of personnel, 2004-2006, share of enterprises having co-operated with each partner (12.12.2008)
- Table 18. Co-operation in innovation activity by location of co-operating partner, 2004-2006, share of enterprises with innovation activity (12.12.2008)
- Table 19. Co-operation in innovation activity by location of co-operating partner and size category of personnel, 2004-2006, share of enterprises with innovation activity (12.12.2008)
- Table 20. Observed effects of product and process innovations, 2004-2006, share of enterprises with product or process innovations (12.12.2008)
- Table 21. Enterprises indicating high or medium effects of product and process innovations by size category of personnel, 2004-2006, share of enterprises with product or process innovations (12.12.2008)
- Table 22. Prevalence of marketing and organisational innovations by size category of personnel, 2004-2006, share of enterprises (12.12.2008)
- Table 23. Prevalence of marketing and organisational innovations by industry, 2004-2006, share of enterprises (12.12.2008)
- Table 24. Prevalence of marketing and organisational innovations by form of enterprise, 2004-2006, share of enterprises (12.12.2008)
- Table 25. Developers of organisational and marketing innovations by size category of personnel, 2004-2006, share of enterprises and of enterprises with innovations (12.12.2008)
- Table 26. Prevalence of organisational innovations by size category of personnel, 2004-2006, share of enterprises (12.12.2008)
- Table 27. Prevalence of organisational innovations by industry, 2004-2006, share of enterprises (12.12.2008)
- Table 28. Organisational innovations integrated with or linked to other types of innovations, 2004-2006, share of enterprises with organisational innovations (12.12.2008)
- Table 29. Observed effects of organisational innovations, 2004-2006, share of enterprises with organisational innovations (12.12.2008)
- Table 30. Enterprises indicating high or medium effects of organisational innovations, 2004-2006, share of enterprises with organisational innovations (12.12.2008)
- Table 31. Prevalence of marketing innovations by size category of personnel, 2004-2006, share of enterprises (12.12.2008)
- Table 32.Prevalence of marketing innovations by industry, 2004-2006, share of enterprises (12.12.2008)
- Table 33. Prevalence of marketing innovations integrated with or linked to other types of innovations, 2004-2006, share of enterprises with marketing innovations (12.12.2008)
- Table 34. Observed effects of marketing innovations, 2004-2006, share of enterprises with marketing innovations (12.12.2008)
- Table 35.Enterprises indicating high or medium effects of marketing innovations by size category of personnel, 2004-2006, share of enterprises with marketing innovations (12.12.2008)
Updated 12.12.2008
Official Statistics of Finland (OSF):
Innovation [e-publication].
ISSN=1797-4399. 2006. Helsinki: Statistics Finland [referred: 14.2.2026].
Access method: http://stat.fi/til/inn/2006/inn_2006_2008-12-12_tie_003_en.html

